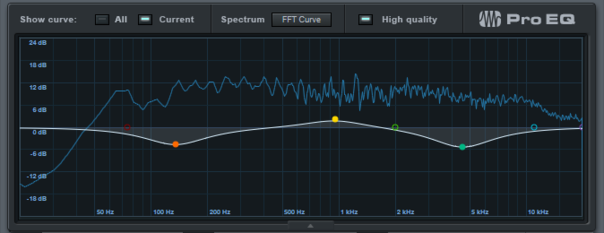
It’s not always obvious how spectrum analyzer parameters influence what you see
Spectrum analyzers can definitely help during the mixdown process by either providing visual confirmation for what you think you hear, or providing a visual “early warning system” for issues you haven’t heard yet. Spectrum analyzers range from simple eye candy toys to sophisticated test equipment, but even some of the more modest ones have adjustable parameters so you can customer their response. However, it’s not always obvious what these parameters do. So, here are the most common parameters, and what they mean.
CUSTOMIZING SPECTRUM ANALYSIS RESPONSE
Spectrum analyzers vary greatly in terms of their adjustable parameters, from simple – you can’t adjust anything – to multiple parameters that let you customize the analysis and display process. Here are some of the most common parameters.
- FFT size determines the number of samples per band. Higher numbers give better frequency resolution, but require more time to compute the display. When you’re looking for frequency anomalies, use a high value, like 16K or 32K. This catches very narrow peaks that might not be seen with smaller FFT sizes.
- FFT overlap sets the amount by which the analysis bands overlap. Higher values (50% and above) provide a more accurate analysis, but increase display computation time.
- Smoothing window determines the analysis algorithm. Different algorithms trade off sharpness of peaks and leakage between neighboring bands (i.e., data in one band influences the ones next to it). Triangular is a compromise between peak sharpness and leakage, Rectangular provides accurate drawing of peaks but high leakage, while Blackman-Harris has little leakage, but the peaks look more rounded.
- 3D vs. 2D shows the information in different ways. 2D shows amplitude vs. frequency, while 3D displays a series of “slices” within the selected region to relate time to frequency and amplitude.
- Range, reference, etc. are parameters that let you adjust the scale, zoom in on specific areas of the graph, change the 0dB reference, etc.
- Linear vs. log response is best set to Log for audio work, as the curve more closely approximates how your hearing works.
- Maximum retains the highest levels reached in each band – like the “peak hold” function found on some VU meters.