Specifications don’t have to be for geeks only—they’re not that hard to understand, and can guide you when choosing audio gear
Specifications don’t have to be the domain of geeks—they’re not that hard to understand, and can guide you when choosing audio gear. Let’s look at five important specs, and provide a real-world context by referencing them to TASCAM’s US-2×2 and US-4×4 audio interfaces.
First, we need to understand the decibel (dB). This is a unit of measurement for audio frequency levels (like an inch or meter is a unit of measurement for length). A 1 dB change is approximately the smallest audio level difference a human can hear. A dB spec can also have a – or + sign. For example, a signal with a level of -20 dB sounds softer than one with a level of -10 dB, but both are softer than one with a level of +2 dB.
1. What’s frequency response? Ideally, audio gear designed for maximum accuracy should reproduce all audible frequencies equally—bass shouldn’t be louder than treble, or vice-versa. A frequency response graph measures what happens if you feed test frequencies with the same level into a device’s input, then measure the output to see if there are any variations. You want a response that’s flat (even) from 20 Hz to 20 kHz, because that’s the audible range for humans with good hearing. Here’s the frequency response graph for TASCAM’s US-2×2 interface (in all examples, the US-4×4 has the same specs).
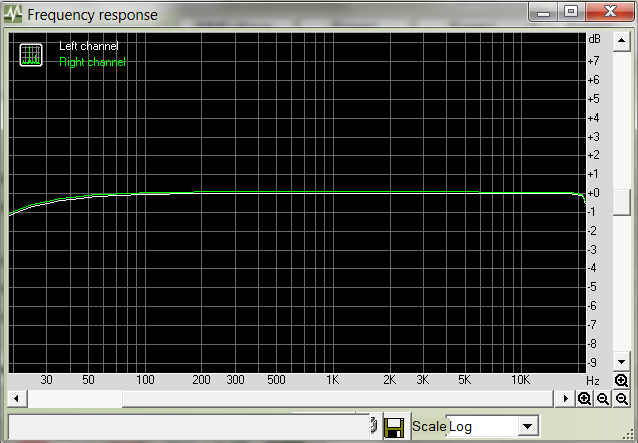
This shows the response is essentially “flat” from 50 Hz to 20 kHz, and down 1 dB at 20 Hz. Response typically goes down even further below 20 Hz; this is deliberate, because there’s no need to reproduce signals we can’t really hear. The bottom line is this graph shows that the interface reproduces everything from the lowest note on a bass guitar to a cymbal’s high frequencies equally well.
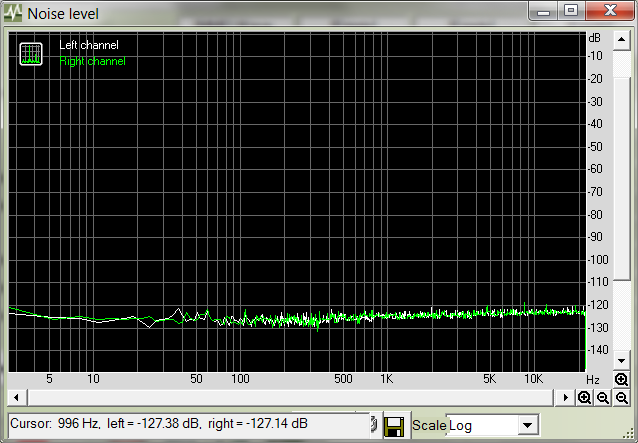
2. What’s Signal-to-Noise Ratio? All electronic circuits generate some noise, so you want the lowest possible noise level. Noise increases as you turn up the gain. For example, here’s the US-2×2’s mic preamp noise with the volume turned up a fifth of the way.
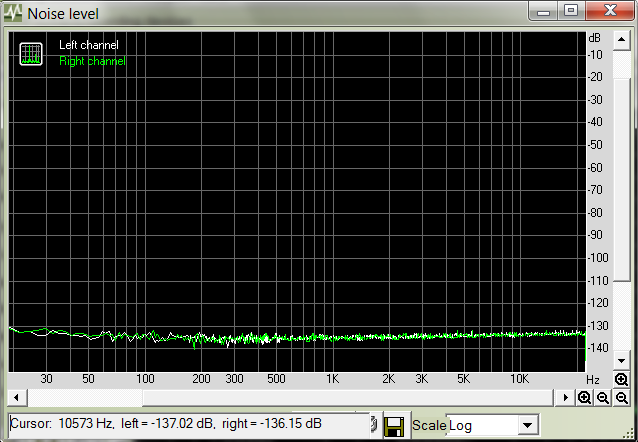
The noise is less than -130 dB—in other words, compared to a signal at full level the noise is over 130 dB softer. This means the signal-to-noise ratio (the ratio of the full-level signal to the noise) is 130 dB, which is extraordinarily quiet. But what happens if we turn up the mic preamp gain two-thirds of the way (about right for recording a really quiet vocalist)?
Now the noise level is less than -110 dB. This is still extremely quiet, and backs up TASCAM’s claims regarding their mic preamps’ performance. Consider that Compact Discs can at best reproduce levels no lower than about -90 dB—so essentially, the noise is so low even a CD can’t reproduce it.
These two graphs also hint that specs have the potential to mislead rather than enlighten. Company “A” might use a graph like the upper one for their marketing, while Company “B” might choose a more “real-world” graph like the lower one. Company “A” could imply their mic preamp is quieter—“just look at the graphs!” So it’s important to know the conditions under which specs are taken. In this article, all the specs (except for the first noise graph and second crosstalk graph below) are with the mic preamps turned up two-thirds of the way to reflect real-world, not theoretical, conditions. This underscores that even when pushed, these mic preamps have excellent specs.
3. What’s Total Harmonic Distortion? As all guitarists know, distorting a signal adds harmonics—and we love them! But just as all circuits generate some degree of hiss, they also generate some degree of distortion. Total Harmonic Distortion graphs show the level of the harmonics generated by distortion.
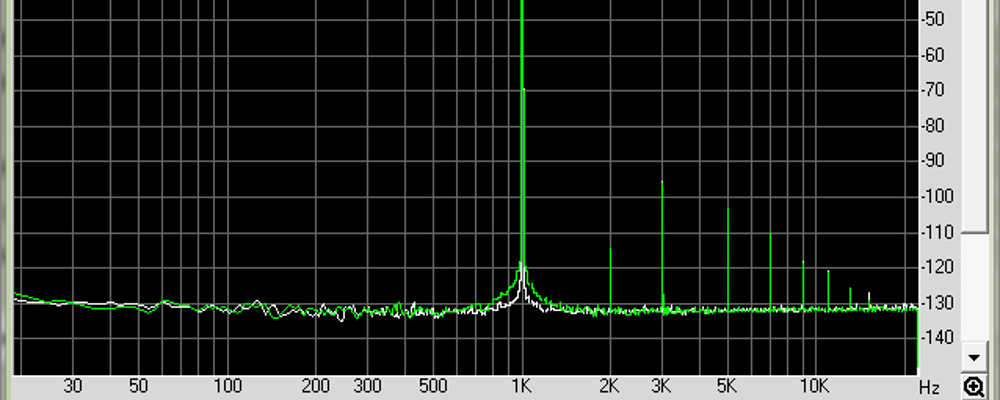
This test feeds in a 1 kHz signal at maximum level. In theory, the output should consist only of that 1 kHz signal. Any other signals represent distortion. The following is a real-world example, with the mic preamp gain turned up about two-thirds of the way.
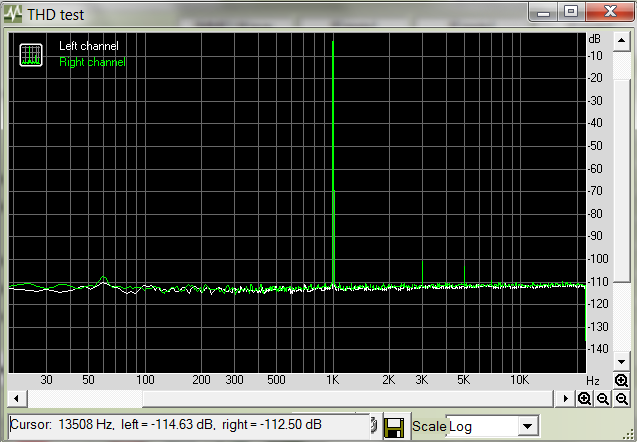
This graph shows a little bit of 3rd harmonic distortion at 3 kHz and 5th harmonic distortion at 5 kHz. Both are below -100 dB, and any other harmonic distortion is so low, it’s below the noise. The fact that there are only two visible harmonics, and that they’re so low-level, speaks to the interface’s quality.
If we reduce the mic preamp gain all the way to reduce the noise floor, it’s much easier to see the low-level distortion components.

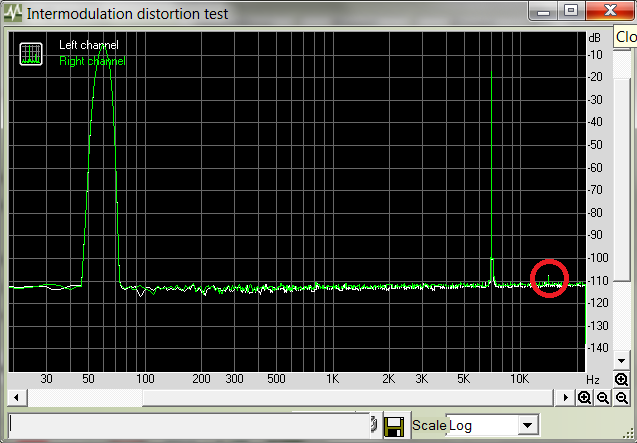
4. What’s Intermodulation Distortion? This type of distortion occurs when two signals interact with each other to produce additional signals. These additional signals also represent distortion, and many people consider intermodulation as more objectionable than harmonic distortion. This test feeds in two signals at maximum level, one at 60 Hz and one at 7 kHz. Any output signals other than these two frequencies represent distortion.
Unfortunately (or actually, fortunately for owners of these interfaces) the intermodulation distortion is quite low, so with realistic mic preamp levels, it’s very difficult to see any additional signals, but if you look closely, you’ll see a tiny little spike (circled in red so you don’t miss it) poking its head up from the noise.
Reducing the noise to the bare minimum by setting the mic preamp gain to minimum makes it easier to see the intermodulation distortion components.

5. What’s Crosstalk? Crosstalk occurs when one channel picks up some of the signal from another channel. This happens because some circuit elements radiate signals, while other elements can pick up those signals. Careful mechanical design and signal isolation can reduce crosstalk, but you can’t get rid of it entirely. Crosstalk is more likely with high gain, high frequencies, and often, low frequencies.
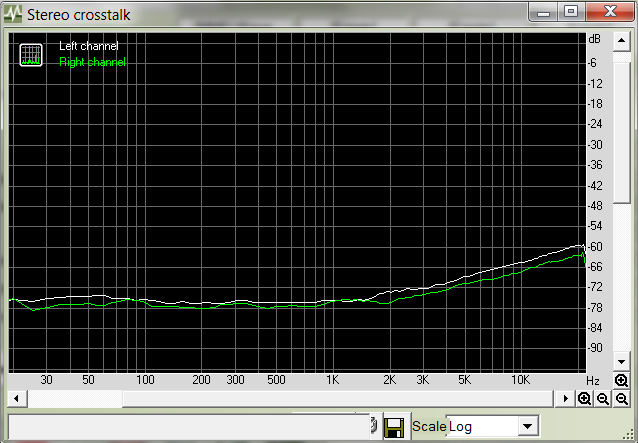
This crosstalk spec is comparable to similarly priced devices, although other interfaces sometimes have a low-frequency crosstalk increase that’s not present here. But remember, this is at a high gain setting. When you turn down the gain to a level suitable for recording an instrument like steel-string guitar, crosstalk goes way down.
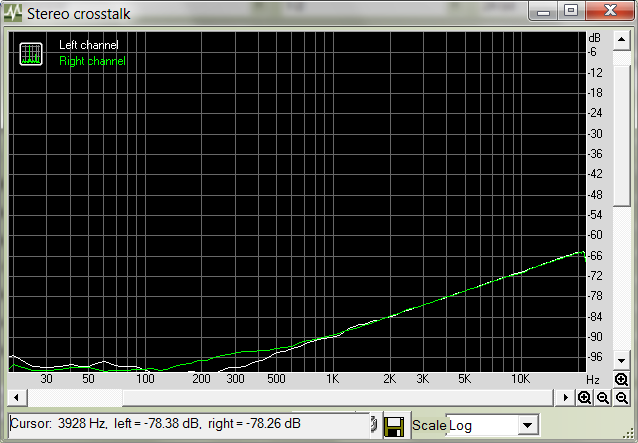
This helps illustrate an important point: Specs can be a “snapshot” of a gear’s particular state, or be represented by a range of numbers. So, use specs as a guide, not a judge. Granted, the specs for these TASCAM interfaces are very good. But what made me curious to check them out is that the interfaces sounded good—and I guess that’s the ultimate spec.