Meters can tell you a lot about what’s happening with your audio
Analog or digital meters give you insights as to whether your signal levels are adjusted optimally. And now, digital metering gives us more options than ever before for analyzing signal levels.
ANALOG VS. DIGITAL METERS
For decades the analog meter VU meter (Fig. 1), consisting of a pointer that swung further to the right with increasing signal level, was our main signal strength indicator. A true VU (volume unit) meter is calibrated not only to a particular signal level, but also has specific ballistics characteristics so that the meter pointer moves predictably.
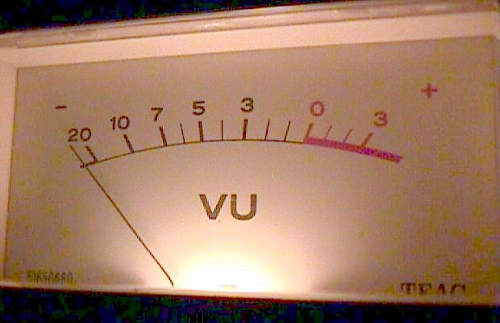
Mechanical VU meters show average, not peak, signal levels. For example, a transient may reach a very peak high level, yet not last long enough to cause the meter to register. This can be confusing when recording percussive instruments, because the meter might indicate an average of around -20 VU, even if the signal peaks hit well above 0 VU.
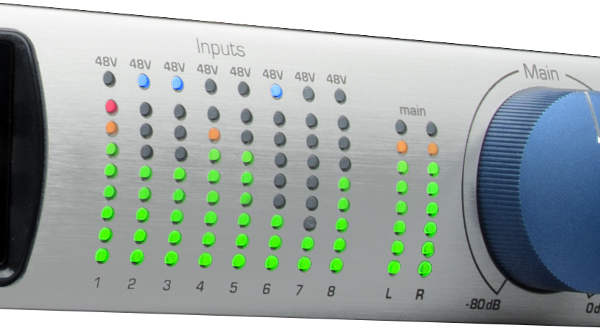
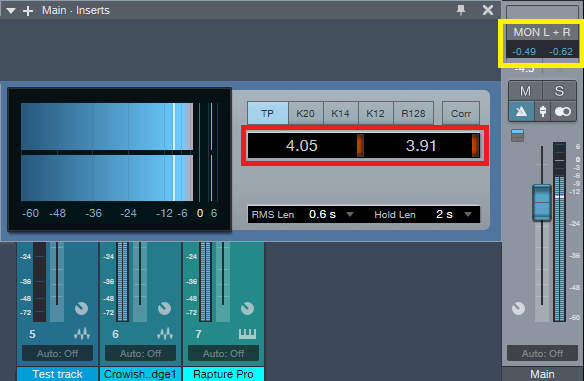
Digital meters, whether based on multiple LEDs, a vacuum fluorescent display, or LCD, are more precise than analog meters (Fig. 2).
Digital meters can extend very short transients so they can be seen more easily (clipping indicators do this too). Some digital meters include a “peak hold” feature that retains the highest level attained; lower signal levels continue to be shown normally. This “hold” may last for just a second or two, but there could also be an “infinite hold” option, which holds the highest peak until reset. This is great if you want to make sure that you’re using the full available dynamic range, without having to keep your eyes glued to the meter.
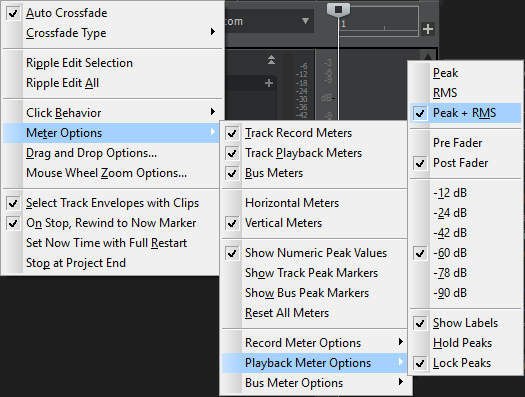
Although digital meters are inherently peak-indicating devices, some can switch between peak or average level. Each has different uses. For example, when adjusting a compressor, adding compression usually reduces the overall peak level compared to the uncompressed signal. You then increase the compressor’s output gain parameter to match the compressed and uncompressed sounds’ peak level, which is typically the maximum available headroom. An average-reading meter is not as helpful as monitoring peaks, because compression, by definition, greatly increases the average signal level. If you lower the compressed signal’s average level so that it matches the bypassed signal’s average level, the compressed sound’s peak value would probably fall way short of the maximum available headroom.
Average-reading meters are useful when mastering, because you generally want consistent levels from song to song. The ear finds songs with similar average, not peak, levels more consistent-sounding. Of course, you should primarily use your ears to judge song-to-song level matching, but average-reading meters can provide a reality check.
CLIPPING INDICATORS
While not exactly full-blown meters, clipping indicators are a variation on digital metering. Usually they are bi-color LEDs that glow green when signals are present, but glow red when clipped.
However, these are fairly ambiguous devices because there is no standard level to indicate “clipping.” Some clipping indicators truly indicate clipping; in other words, as soon as a signal distorts, the LED glows red. Some designers argue that this is not useful information, because if the signal is clipping, then it’s already too late to do anything about it by bringing down the levels. So, they may set the clip indicator to light when the signal is, say, -3 dB below the clipping point. Thus, if the indicator glows, you can trim the level back; however with this approach, you don’t know whether the signal has really clipped. The most useful LED clipping indicators have three color indications: green for normal, yellow or orange for pre-clip (e.g., -6 to 0 dB), and red for actual clipping.
By the way, note that with 20 and 24-bit gear, we can get a bit lazier about level-setting – set your peaks a few dB lower than usual just in case there are some unforeseen volume boosts, and you’ll still have plenty of headroom left. That’s when you’ll really appreciate a digital meter’s peak-reading and holding abilities, because you can make sure that any peaks occur at the desired level below the maximum available headroom (e.g., -6 to -10 dB).
METER PLACEMENT IN THE SIGNAL PATH
In a mixer or signal processor, where you put the meter in the signal path can make a big difference in whether the results are useful or not. With virtual mixers, if the meters are pre-EQ and the EQ adds sufficient gain to cause clipping, the meters won’t indicate this distortion. I always place meters post-EQ, if possible.
A similar issue occurs with signal processors. If the meter monitors the incoming signal, then you can see whether the input is being overloaded, which is useful information. However, clipping could occur within the DSP if you use filters with high resonance, lots of feedback with delay patches, or resonant flanging. Being able to monitor the post-DSP signal will alert you to DSP-related distortion.
DIGITAL METERING LIMITATIONS
Let’s close out with a look at some of the problems you can run into with digital metering.
To indicate clipping, digital meters often require that several consecutive samples clip. Therefore, if only a few samples clip at a time, your meters may not indicate that clipping has occurred. The only way to know for sure if clipping has occurred is to look at the waveform in a computer-based audio editor, and check whether any peaks are “squared off.” If possible, search for the maximum level (otherwise go through the file manually), and visually inspect the waveform for the “flat top” that indicates clipping (Fig. 3).
INTER-SAMPLE DISTORTION
With most DAWs, you can go well into the red on individual channels because their audio engines have virtually unlimited headroom (thanks to 32-bit floating-point math or better, in case your inner geek wondered). However, when those signals hit the output converters to become audio, headroom goes back to the real world of 16 or 24 bits, and any overloads may turn into distortion.
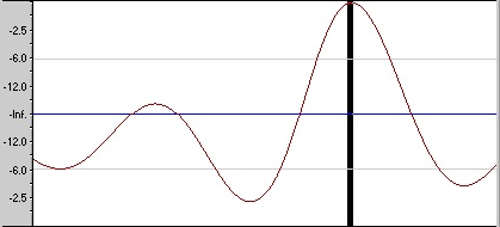
So if the meters don’t show clipping you’re okay, right? Maybe not. Most meters measure the actual values of the digital waveform’s samples, prior to reconstruction into analog. But that reconstruction process might create signal peaks that are higher than the samples themselves, and which don’t register on your meters (Fig. 4).
Sure, digital meters are a bit more complicated than the analog kind; but as we’ve come to expect with digital gear, we get a lot more flexibility as well. Sometimes this is a tradeoff well worth making.