Many people consider the audio phase meter as being mostly only for checking final mixes. However, one very useful technique is putting it in the master output bus, and soloing one track at a time. This gives some insights into the phase, level, and stereo spread of individual tracks in a way that’s more revealing than just looking over panpots.
CORRELATION METER BASICS
In brief, the Correlation meter (often a bar graph included with a Phase meter, but it may be separate) indicates a stereo signal’s mono compatibility. This was of crucial importance when mastering for vinyl, because it could indicate if there were out-of-phase audio components in the audio that could possibly cause the stylus to jump out of its groove. These days, it’s largely a stereo world but it’s still important to check for mono compatibility—after all, when listening to speakers, you don’t have perfect stereo separation. You’ll usually monitor correlation in the master bus, but for individual tracks, it can indicate whether (for example) a signal processor is throwing a track’s left and right channels out of phase.
The Correlation meter reading spans the range between -1 (the right and left channels are completely out of phase, with no correlation) and +1 (the right and left channels are identical, and correlate completely). With most mixes, the bar graph will fluctuate between 0 and +1.
MONO READINGS
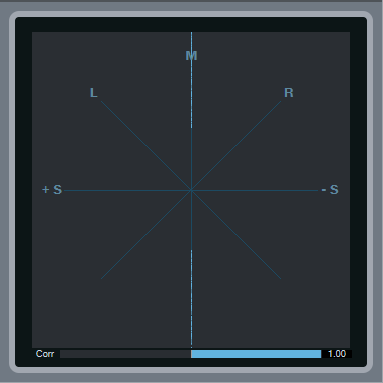
If the Phase meter displays a single vertical line, then the left and right channels are identical, and the track is mono. The Correlation bar graph meter at the bottom confirms this with its reading of 1.00, which means the left and right channels correlate completely—in other words, they aren’t just similar, but identical.
LEFT AND RIGHT READINGS
If there’s a single, diagonal line on the L axis, that means that all the signal’s energy is concentrated in the left channel. Similarly if there’s a single, diagonal line on the R axis, then all the signal’s energy is concentrated in the right channel. If you pan a track where the left and right channels are identical (as shown by the Correlation meter displaying 1.00), then the line will move from one channel to the other.
STEREO SIGNALS
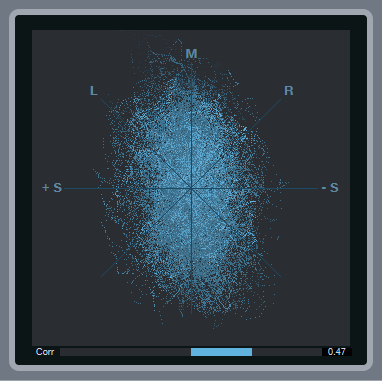
With stereo, you’ll see an excellent visual representation of how much the signal extends into the stereo field. The vertical size indicates the level. As you pan the signal left or right, the stereo field will become narrower around the line that moves from left to right until at one extreme or the other, you’ll see only a diagonal line on the L or R axis.
Note the correlation meter is showing +0.47. This means that there’s about an equal amount of similarity between the left and right channels as there are differences, but nothing is out of phase.
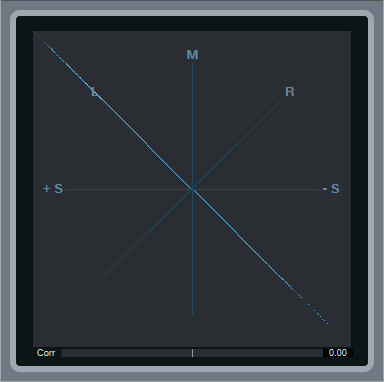
MID-SIDE ENCODED AUDIO
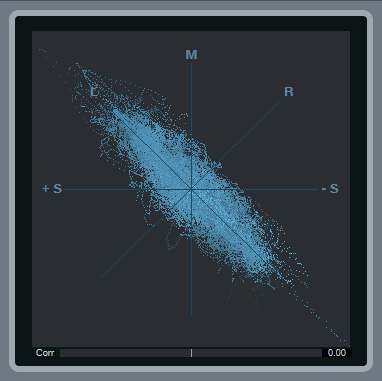
With Mid-Side encoded audio, you’ll see amplitude around the L and R axes, as well as along the M axis. Because the L signal is the center and the R signal the sides, you’ll see a lot more level along the L axis. Also, note the Correlation meter setting of 0.00—this means that there’s no similarity between the right and left channels, which is what you’d expect with a Mid-Side encoded signal.
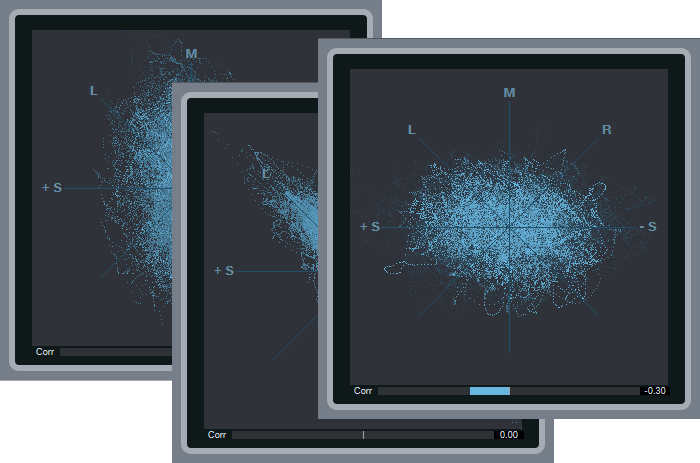
BINAURAL PAN / WIDENED IMAGE SIGNAL
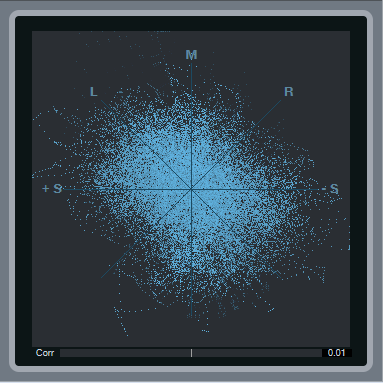
Several plug-ins widen the stereo image, such as Studio One’s Binaural Pan processor, IK Multimedia’s Quad Image, and others. Widening places more energy in the left and right sides than in the center; the image above shows what happens when maximize width. Compare this to the reading for stereo signals—you can see that in this case, the energy extends further out to the right and left. Furthermore, the Correlation meter shows that there are no significant similarities between the right and left channels, which is a result of the widening processors being based on Mid-Side processing.
PHASE ISSUES
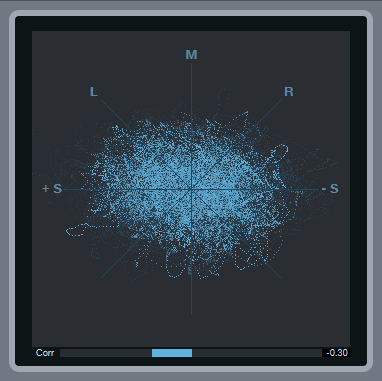
Here, the Correlation meter shows a negative number, which means there are out-of-phase elements within the stereo mix. Occasional negative blips aren’t a problem, but if the Correlation meter spends a substantial amount of time to the left of 0, then there’s a phase issue that will interfere with mono compatibility.